Coarse Filtering
When organizations start down the Advanced Asset Management (AAM) path, developing TAMPs and completing ORDM analysis, there is usually a significant backlog of work that needs to be undertaken.
The immensity of the task often overpowers the staff and they don't know where to start, or how to go about it.
With restricted resources it is vital that we identify the areas in which the key results can be achieved with the resources available.
ORDM analysis can be very complex. There are often a large number of:
- Costs to be identified and calculated, both direct and indirect
- Benefits to be identified and assessed
- Treatment options that may need to be considered for both asset and non-asset options.
It is very important, from a cost effectiveness point of view, to develop a method of filtering out the key treatment options.
It is desirable that we identify the areas of greatest benefit for the organization and then concentrate our resources on delivering this benefit most effectively.
The process suggested is:
- Identify key business drivers for the corporate organization, including:
- Lowest life cycle cost strategy
- Radical debt reduction strategy
- Reduced capital expenditure
- Improve safety record
- Avoid environmental hazards.
- Link these key result areas to the relevant asset management activities
- Debt reduction, including:
- Defer capital expenditure as long as possible (augment, improve, rehabilitate, replace, dispose)
- Reduce operations and maintenance
- Risk exposure.

The next step is to rate the risk cost exposure (of each authority) for each asset or component. This is best done in a staged approach by creating a simple point score system to enable each asset and failure mode to be rated.
It must be remembered that this is the current risk.
All assets can then be ranked to see those that represent the greatest potential benefits to the organization and therefore warrant further investigation.
Simple (interim) filter system
Direct Costs. Costs of Repair | Impact of Failure |
Restoration | Negligible | Minor | Medium | Major |
Less than $10 000 | 1 | 2 | 4 | 6 |
$10 - 50 000 | 2 | 4 | 5 | 7 |
$50 - 500 000 | 5 | 7 | 8 | 9 |
Over $500 000 | 8 | 8 | 9 | 9 |
Risk Reduction – Filtering Process
In What Year is the Failure 100% Probable? | Probability to be Used for Risk Cost Assessment (this year) |
WITHIN 1 year | 0.9 |
WITHIN 2 years | 0.7 |
WITHIN 3 years | 0.4 |
WITHIN 4-5 years | 0.2 |
WITHIN 6-10 years | 0.1 |
WITHIN 11-20 years | 0.05 |
WITHIN 20 years plus | 0.02 |
Cost Reduction - Opportunities
Works Example
Budget Item | Probability | Consequence of Failure | Risk | Priority |
1 | 0.05 | 9 | 0.45 | 3 |
2 | 0.9 | 1 | 0.9 | 2 |
3 | 0.4 | 7 | 2.8 | 1 |
Having determined the high-risk items we can then submit the high-risk assets to a more sophisticated analysis.
This is done using the following system.
More sophisticated (secondary) filter system
This system involves a more sophisticated ranking system that converts our perceived risks into economic values.
Individual Risk Costs (Potential Failures with a Total Risk Cost > $0.5M)
Consequence of Failure Categories | Weighting for Category |
Failure Probability | Within 1 Year | 0.9 | . |
| . | Within 2 Years | 0.7 | . |
| . | Within 3 Years | 0.4 | . |
| . | Within 5 Years | 0.2 | . |
| . | 6 to 10 Years | 0.1 | . |
| . | 11 to 20 Years | 0.05 | . |
| . | > 20 Years | 0.02 | . . |
Repair cost | >$2M | 40 | 1 |
| . | $500k to $2M | 13 | . . |
| . | $100k to $500k | 3 | . . |
| . | <$100 000 | 1 | . . |
Impact of loss of service | Extreme | 150 | 1 |
| . | Major | 75 | . . |
| . | Medium | 15 | . . |
| . | Minor | 3 | . . |
| . | Negligible | 1 | . . |
Potential loss of life/serious injury | 5 (Probable) | 100 | 1 |
| . | 4 | 13 | . . |
| . | 3 | 3 | . . |
| . | 2 | 1 | . . |
| . | 1 (Improbable) | 0 | . . |
Environmental Disturbance | 5 (Probable) | 100 | 1 |
| . | 4 | 55 | . |
| . | 3 | 6 | . |
| . | 2 | 1 | . |
| . | 1 (Improbable) | 0 | . |
Damage to property | 5 (Probable) | 60 | 1 |
| . | 4 | 10 | . |
| . | 3 | 5 | . |
| . | 2 | 3 | . |
| . | 1 (Improbable) | 1 | . |
System Disturbance | 5 (Probable/Major) | 75 | 1 |
| . | 4 | 32 | . |
| . | 3 | 8 | . |
| . | 2 | 1 | . |
| . | 1 (Improbable) | 0 | . |
Develop potential benefit rating system
Based on the key result areas, develop a quick scoring system for the potential benefits to be derived.
Simple system
Potential for reduced risk costs — applicable to all risks.
0% reduction 1
20% reduction 2
40% reduction 3
60% reduction 4
80% reduction 5
Secondary system
Reduction in maintenance | 1-5* |
Reduction in operations | 1-5 |
Improved level of service: | . |
Environment | 1-5 |
Safety | 1-5 |
Political sensitivity | 1-5 |
Image | 1-5 |
Impact on customers | 1-5 |
Extended life/deferred capital investment | 1-5 |
Reduced loss of production or improved income | 1-5 |
* These numbers refer to the reduction percentages listed in 'Simple System' above.
Tertiary method
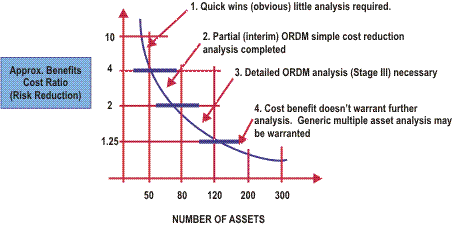
Expand the secondary method as outlined above by completing an approximate estimate of the costs of treatment options likely to achieve the % reductions estimated above and derive an approximate cost benefit ratio.
Rank the assets in order of the cost benefit ratios derived and complete an analysis based on some filter levels suitable for your purpose.
For example:
Greater than 4:1
Adopt most appropriate treatment options (quick wins). Little analysis is required.
2:1 to 4:1
Partial or restricted ORDM analysis completed using simple cost reduction analysis, percentage cost reduction and estimated treatment option cost for each risk cost centre, for example: lost production, environmental damage etc.
1:1.25 to 2:1
Complete full ORDM analysis for assets in this category.
Less than 1:1.25
Rank these assets in order of cost benefit ratio and record this data for future analysis. No further analysis is likely to be warranted on these assets at this stage.

In this filtering process it is important to remember the degree of confidence that we have in the various risk exposure categories. We may have a higher degree of confidence in the direct cost estimates then we do in the indirect (ancillary risk) costs. In the loss of production we may have the correct marginal cost of electricity production but cannot accurately estimate the time out of service and therefore the likely loss of income has a lower confidence level.
We need to keep this in mind and be honest with our assessments.
The direct costs of repair after failure need to be compared with the direct costs of a planned repair. The difference between these figures is the real risk cost exposure where the repair cost would need to be met irrespective of the failure, eg, for replacement/late life rehabilitation options.
Multiple like assets (generic models)
In some cases there are similar types or categories of assets that can be dealt with on a "generic basis".
This can also be used as a form of filter than can be used to reduce the overall costs of analysis for multiple (similar) assets.
Activity based analysis
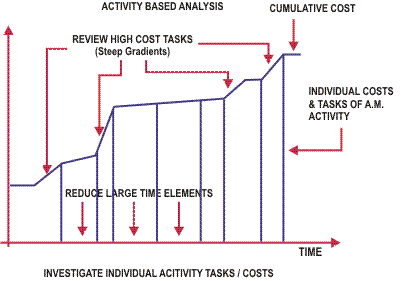
This is one of the basic cost reduction opportunity areas. By choosing an activity that represents a significant cost, a detailed analysis can then be completed.
This is generally done by breaking down the high cost activity into its various tasks, their costs and the time required for each task.
The analysis then concentrates on those tasks that:
- Have the highest costs
- Take the longest time.
Can we reduce the costs? Can we reduce the time taken?
We need to analyze our options, the costs and the benefits to reduce these.

Rank activities on risk cost reduction/potential benefit basis.
Using the figures derived from the above evaluations we can now identify assets that have:
- High (current) risk cost (total)
- High risk costs in specific key business result areas, for example: environment, safety, production interruption
- Good risk cost reduction potential benefit
- Different probabilities of failure and therefore a timeframe for which the risk cost is 100% likely to have occurred.
Depending on the key business objectives or drivers, the organization can then complete detailed evaluation on the issues that are most important to them, for example:
- Public image
- Cost of repairs
- Impact of failure on customers
- System/production downtime.
The total risk reduction potential can then be assessed and used as a ranking priority filter.
Outputs
At the end of this process the organization can then identify the items that:
- Require immediate action
- Can be ranked and programmed in future works program
- Identified as requiring further analysis.
Many renewal works or maintenance items will be identified sufficiently in this process to justify them being included in the current works program. Others may require further work and analysis.
In all cases these works need to comply with the organization's investment evaluation processes or guidelines, for example:
Works up to $10 000 | Senior level approval only |
Works $10 000 - 100 000 | Business plan |
| Evaluation type 1 |
Works $100 000 - $1 000 000 | Evaluation type 2 |
Works over $1 000 000 | Evaluation type 3 |
Tertiary level filters - Rapidly increasing risk exposure
A further enhancement during this stage of the filtering program can be to include a process that will find the risk items that are likely to increase quickly with time.
This is most easily done by repeating the above process using the probability of failure of 5 years time.
In this way we can quickly identify assets that are likely to have a significant risk cost exposure within 5 years. This will then enable the organization to include these in the immediate short-term evaluation program.
Analyze major cost drivers
We can also complete some preliminary analysis on the key cost drivers for all assets under consideration, i.e. the total cost picture.
By analysis the total costs of risk exposure we can identify the major cost drivers which can then be analyzed on a "generic" or "system" basis. This enables us to better understand the key areas, thereby giving us an insight into how to tackle these issues when doing our detailed ORDM analysis on individual assets and components.
Cost of treatment
As a further enhancement we can assess the cost of treatment required to derive the reduction in risk cost.
In this way we can identify those risk costs that can be reduced in the most cost effective way.
It is not intended that this additional step be used to eliminate a full ORDM analysis. It is only intended to be a further filter if the previous processes do not result in reducing the total number of assets requiring full ORDM to a manageable level.
Complete detailed ORDM analysis
For those items identified as requiring further analysis we should then complete a detailed ORDM analysis.