Benefits & Costs
Costs and benefits can generally be categorized as:
- Direct and indirect costs and benefits
- Tangible and intangible costs and benefits.
Direct and tangible costs and benefits are those which relate directly to the project or option in consideration, and they can be easily identified and quantified.
Direct intangible or indirect tangible costs and benefits pose a problem in the identification and quantification process but nonetheless attempt should be made to list them for final qualitative consideration.
Indirect costs and benefits are those which do not directly result from the project, but from "second round" effect. These normally should not be considered as benefits or costs in the evaluation because all projects or options will have second round effects.
The benefits and costs normally extend far beyond the organization, but if we consider the objective of the organization is to maximize the return on its investment, then only those directly affecting the organization should be considered.
This is the premise on which ORDM methodology is constructed.
This topic also covers:
Costs of Renewal
The costs associated with any treatment strategy are relatively easy to identify as they are mainly associated with those upfront capital costs and the annual costs required in terms of maintenance and generation.
The capital costs should include all costs up to the time that the renewal strategy is completed — all costs likely to be expended on the project, namely:
- Planning
- Strategy assessment and development
- Final design reports
- Survey
- Design and documentation
- Construction/acquisition
- Project management/contract administration
- Commissioning
- Asset handover.
The annual operating costs generally include operation (regular and cyclic between the scheduled renewal) labor, fuel and power. These can be estimated generally to a reasonable degree of accuracy.
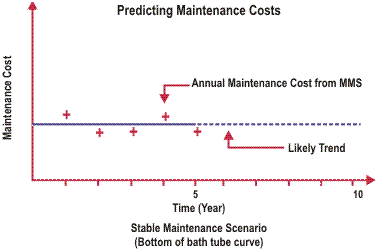
Maintenance costs are more difficult to estimate, but past records and similar maintenance activities should provide realistic order of estimates. Any MMS system needs to be able to call up the total maintenance costs history for the previous 5 years.
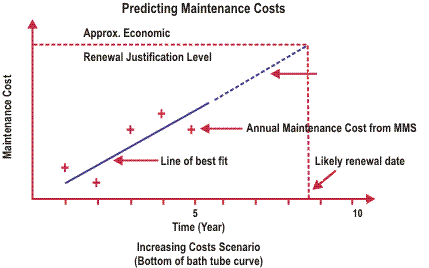
It should be capable of graphing these costs and then adopt a curve of "best fit" to this data projecting it forward in time.
This allows maintenance staff and ORDM analysts to predict the time (point) at which maintenance costs may reach the level to justify a renewal option. This relates to high cost maintenance failures.
This output is also useful for staff to predict the reduction or saving in maintenance costs that can be derived from Optimized Renewal Decision Making (ORDM).
It is also useful in predicting budget variations for and the preparation of any Asset Management Plan (AMP) or budget strategy.
The same ability to call up operational cost history is required for operational costs.
This is generally used for:
- Reduced operating cost likely for ORDM
- Budget preparation
- Asset management plan (AMP) inputs.
For many renewal decisions the key issue in justifying the benefits to the level required by the organization's investment guidelines is the "Reduction in Risk Cost" component.
All failures represent a cost to the organization, the direct cost to repair or rectify the failure and the indirect or ancillary costs of the failure (i.e. image, impact on customers affected etc.).
For many assets these failures will be minimal and will have little effect on the business. In other cases the mode of failure is more critical and the consequences of failure (outcomes) more severe. This applies to assets with a catastrophic failure mode.


The risk cost of this failure needs to be identified and assessed in economic terms.
At the present date the renewal benefits including the "current risk cost" may be insufficient to meet the cost benefit ratio required for the project (renewal) to proceed.
However, as the asset ages, the probability of failure will increase and therefore the "current risk cost" and its subsequent reduction (benefit) will also increase.
At some point in time the "risk cost" may reach the level that will raise the overall benefits to a stage where the renewal option can be justified.
It is desirable that the AM system assists staff to predict the increase in "Risk Cost" against a time scale.
This prediction system would use:
- The cost of the consequences of failure from the risk management module (current value).
- The probability of failure from either:
- The condition/value decay prediction curve
- Or the failure history (performance of the asset) from the maintenance management system.
In come cases the critical (or even single) greatest benefit will be the reduction in risk exposure. In these cases it is also important to predict the overall increase in risk or potential benefit.
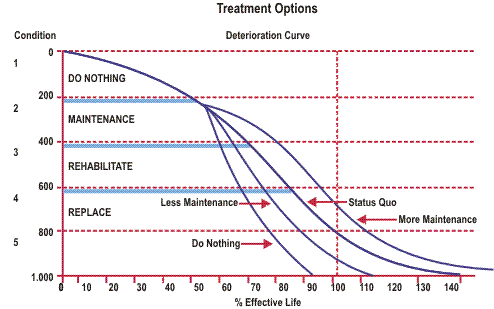
Two strategic scenarios are likely to result in the loss of asset life. These will generally be the "Do Nothing" and "Less Maintenance" scenarios.

It is assumed that the status quo option will ensure that the asset achieves the effective life as developed from our condition decay assessment.
To assist analysts to estimate the loss of life from these scenarios we have developed the following table as a default estimate for the "do nothing" scenario.
Analysts need to estimate the percentage of this impact (%) that would be applicable to the "less maintenance" scenario keeping in mind the deviation from the status quo.
Impact of Do Nothing Options on Effective Lives (Existing Passive Assets)
Current Asset Age% of Effective Life | Reduction in Effective Life (i) | Reduction in Residual Life (ii) |
Juvenile 0% - 20% | 20% | 15% |
Adult 20% - 50% | 15% | 20% |
Mature 50% - 75% | 10% | 25% |
Old 75% - 100% | 5% | 30% |
We need to assess the expected effective life of the pipe based on the current maintenance (status quo). Knowing the life to date (LTD) of the asset under review we can then use either of the approaches (i) or (ii).
This is an example only. Analysts need to assess the likely figures for their particular assets after considering the available data, estimated decay curve and previous asset history.
Wherever possible analysts should try to accurately predict the loss of life that may result from the two scenarios especially the impact of less maintenance. In this instance a pro-rata estimate of the above "do nothing" table figures would be suitable.
As the ORDM module only works on the estimated positive life extension the software does not effectively cope with a negative loss of life.
This is in fact not a benefit (as is life extension) but it should be a cost in the assessment process.
Analysts should assess the effective loss of life by estimating the additional costs of bringing forward the replacement or rehabilitation options.
Two of the statements we often hear are:
"Based on our current maintenance costs and the expected increases we can justify renewal of the asset within 12 months".
"We have been caught in a "catch 22" position. Having restructured, optimized maintenance activities, contracted out non-core activities and improved our productivity, we have now reduced our maintenance costs to such a low level that we cannot justify a renewal program (that we think is necessary)".
We would rather hear the first response than the second, however both of them may not be true.
The organization may have reduced maintenance to less than optimal. However in most cases, the current maintenance (status quo) has never been logically analyzed and optimized against do nothing and other renewal options.
We need to ensure that the maintenance costs used in the renewal evaluations are appropriate and not too high or too low.
It must be remembered that renewal decisions are not based on only maintenance improvements but on many other factors such as:
- Operational savings
- Administrative savings
- Reduced business risk exposure
- Loss of production
- Improved level of service
- Improved value of asset or life extension.
We do need to:
- Be productive and efficient in all that we do
- Ensure that we only justify maintenance on an effectiveness, efficiency and economic viability basis.
Until we have analyzed the performance that we need to get from the asset and match it to our business objectives and plan, we cannot say what is the most appropriate maintenance plan and therefore appropriate maintenance costs.
Now is the time for groups like this to complete a detailed maintenance analysis and decide on the most appropriate maintenance practice matched with the optimal renewal option.
We must try not to focus on the single issue of maintenance but always keep our mind open to all the options and opportunities that are presented to us.
In assessing the extension of life of a parent asset we must always recognize that the ultimate life extension may be controlled by the life of the individual components that make up the parent asset or facility asset as a whole.
When we assess the extension of life that may be gained we should always think of the individual lives of the various components and apply the "weakest link in the chain theory" to our analysis.
The effective life of the parent asset will relate to these significant failures.
In assessing the life extension for the treatment options of replacing or rehabilitating these components we must not only look at the new life of the component but the life of the system as a whole and its major components.
If we assess a treatment option for replacing or rehabilitating the components then we also need to check that all the other major components of the system will derive the new expected effective life of the components or make allowances for the work required to ensure that that happens.
For some assets the modeling of predictive decay scenarios is relatively simple especially where they consist of one major component (e.g. electrical conductors). In most cases the asset can be considered as one service unit even though it may consist of individual components.
Before we complete an ORDM analysis we need to decide on the most appropriate approach to conduct this analysis.
In deciding the approach to be taken we should take into account the:
- Failure modes of the asset as a whole and its individual components
- Key objectives of the strategy in relation to the organization's business objectives
- Degree of sophistication warranted for the strategy development taking into account the costs of the analysis judged against the potential savings.
For example, a waste water collection system can be assessed in different ways:
Alternate Approaches to ORDM Analysis
METHOD No | TYPE |
1 | FACILITY ANALYSIS
TREAT AS A WHOLE |
1(a) | SEPARATE INTO PIPES AND FIXTURES/FITTINGS |
2 | COMPONENT ANALYSIS
SEPARATE PIPE INTO VARIOUS COMPONENTS:
Joints
Pipe barrels
External protection
Internal lining
Supports (if above ground)
Thrust blocks etc. (if below ground)
Treat values and fittings separately |
3 | SOPHISTICATED ANALYSIS
BREAK UP COMPONENTS:
Pipe barrels
Steel Plate (top, bottom, over supports)
Horizontal welds
Vertical Welds |
Note: For each option the pipeline could be treated as the:
- Total length, or
- Key segments or sections likely to be renewed.
The option adopted will be dependent on the:
- Condition of the pipeline along its length
- Condition of the various components that make up the pipeline
- Objective of the study
- Business viability of the organization
- Degree of confidence in the future utilization of the asset.
It is important to think these issues through and decide on the most appropriate approach for the assets under consideration. In many cases it may be desirable that we complete the analysis using a variety of approaches taking the outputs that prove to be the most satisfactory for our purposes.
For vary valuable and critical assets it may be warranted to complete an even more sophisticated analysis as shown in Method 3.
This could prove to be effective where the asset is critical to the business and the cost of renewal is significantly less than the replacement cost.
In this way, we then will be able to justify renewals of:
- Internal lining
- External protection
- Expansion joint replacement
- Repairs to poor vertical joints
- The inserts of protection over support pedestals.
|
|
previous |
home
|
next |
|
Repair Replace Rehabilitate Options |
|
Renewal Decision Analysis
|
|