Overview
This topic includes:
It is essential to be able to manage the risk of failure and cost of failure, within the resource limitations of the organization, to match its customer’s expectations. It is also important that the risk management policies and practices are made known to customers, regulators and insurance providers so that expectations are met.
Risk involves the probability of occurrence and the resulting damages. In an economic risk analysis the cost of risk is often measured in terms of the probability of failure and the cost of the consequences of failures.
CURRENT RISK COST | = | COST OF THE CONSEQUENCES OF FAILURE | X | PROBABILITY OF FAILURE |
This technique can be applied to either the failure of an asset to continue to give service, the failure to provide for a new service, or failure to meet demand placed on a service (capacity failure).
The management of risk requires that processes be set up to:
- Identify the risks
- Quantify the cost of the consequences of failure.
Not all risks are the same. Some risks are acceptable because they pose little consequence to the responsible authority.
Some risks events could be marginal, because they are not economically justified they should be tolerated.
Some risk events are unacceptable as they may violate legal or legislative requirements, the failure of which may result in litigation.
Some risk events will have substantial consequences or costs that are so high that they must be reduced to acceptable levels or avoided (if possible).
It is important to be able to carry out a critical evaluation based on the social, political, economic and environmental impact resulting from the failure:
- Threat to life, health and standards of service
- Disruption to the community
- Adverse effects on the environment
- Property damage and litigation
- High damage/repair cost
- Severe traffic and other social disruption
- Cost to businesses
- Image of organization.
The level of acceptable risk needs to be determined so as to set priorities, either in terms of rehabilitation/replacement, or the degree and type of maintenance required to match the total costs of the failure including the risk.
In some cases the organization may be able to transfer a portion of that risk through insurance cover, however on issues of due care or negligence this will be more difficult. Effective asset management will enable the organization to reduce the cost of this insurance.
Assets for which failure could result in severe consequences, are considered critical assets. To be able to identify critical assets in an objective and consistent way it is necessary to have a systematic procedure of identification. A procedure which can assign numeric values or allocate levels of acceptability (ranking) to the above factors will enable the assets to be categorized as either critical or non-critical, and ranked in order of priority.
In an ideal situation this would be achieved by identifying the actual cost of the consequences of failure. In the real world however the costs are often social or political in nature, and difficult to quantify.
The philosophy for the ranking is not necessarily to determine the absolute value of the cost of failure, but to establish a relative priority order based on the relative value of the cost of failure.

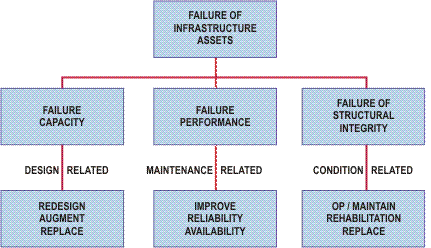
Please note there are many variations on the above failure modes. For critical assets with catastrophic failure modes, the greatest benefit is the reduction of risk. It is not easy to quantify the risk cost, but the consequence of failure and the probability of failure may be estimated with a relatively high degree of confidence by using local knowledge and past records of failures.
The key is to determine when the renewal works can be justified.
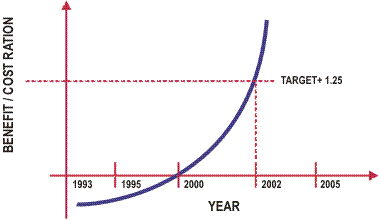
The assessment of business risk cost should be done on a cost benefit basis. The organization should determine an acceptable cost benefit ratio for the purposes of ranking the work, e.g. +1.25. The risk assessment process should then determine the date at which the proposed works would reach this cost benefit ratio and this can then be used to determine the future cash flow needed for renewal works.
The objective is to identify only those works that constitute an unacceptable risk to the organization. This may mean passing up opportunities to make investments that may have a benefit in terms of extending life, etc.
To obtain these outputs, the following inputs are required:
- Quantifying the consequences of failure in $ terms
- Determining the costs (resources) required to avoid or reduce the consequences substantially
- Determining the current risk cost by using the appropriate probability of failure as the asset ages.

Cost Benefit Ratio
The assessment of the predicted time at which the cost benefit ratio reaches an acceptable level, is an important step in the development of a future optimized renewal decision making model, and therefore should be undertaken as part of a strategic review of assets.
There are two methods used for calculating the Risk Cost exposure on decaying assets.
This example shows the two methods for a Water Canal flume that:
- Has a consequence of failure estimated at $4 556 000
- Is expected to fail within 10 years.
Method One identifies the peak risk in NPV terms at the decision point e.g. 2005. Alternatively we can wait and consider the full value for the year in question.
Method Two uses the annual increase in risk cost exposure and brings this back as a present value to the decision point.
The results will vary depending on the:
- Variation (increase) in the probability of failure
- Size of the consequence of failure
- Discount rate used.
Organizations can use either method or can use both methods and adopt the preferred figure.
Examples of Two Methods of Risk Cost Exposure Calculations
| YEAR |
| | 2005 | 2006 | 2007 | 2008 | 2009 | 2010 | 2011 | 2012 | 2013 | 2014 |
Method One |
Condition base probability of failure | .06 | .08 | .10 | .12 | .14 | .18 | .24 | .32 | .54 | 1.00 |
Consequence of failure | 4 556 | 4 556 | 4 556 | 4 556 | 4 556 | 4 556 | 4 556 | 4 556 | 4 556 | 4 556 |
Annual risk cost exposure | 273 | 364 | 456 | 546 | 639 | 820 | 1 093 | 1 458 | 2 460 | 4 556 |
Disc factor (12%) | .8928 | .7972 | .7118 | .6355 | .5674 | .5066 | .4523 | .4039 | .3606 | .3220 |
Annual discounted risk cost NPV to 2004 | 243 | 290 | 324 | 347 | 362 | 415 | 495 | 588 | 887 | 1 458 |
Peak PV | 1 458 | | | | | | | | | |
Method Two |
Annual increased risk cost exposure | 273 | 91 | 92 | 90 | 93 | 181 | 273 | 365 | 1002 | 2096 |
PV disc | 243.7 | 72.5 | 65.5 | 57.2 | 52.8 | 91.6 | 123.5 | 147 | 361 | 675 |
Risk cost NPV 2004 | 1 886 | | | | | | | | | |
The actual (current) risk cost exposure should be used. We are looking for the point in time at which the direct costs and the risk exposure are large enough to provide the return on the investment made to avert or reduce the failure.
Where the consequence of failure exceeds the cost of averting failure, the asset is said to be critical.
For those assets where the consequences of failure are less significant, it may take several failures each year (or over a period) to warrant remedial action being taken.
Costs associated with repairing the collapsed flume are:
Item | Activity | After Failure | Before Failure |
1 | Establishment | | |
| Upgrade access, 500 m @ $250/m | = $ 125 000 | $ 80 000 |
| Site offices, services | = $ 20 000 | |
2 | Clean-up | | |
| Remove damaged flume panels, | | |
| 10 off x 3.6 m x 3.05 m x 0.3 m thick @ $200 | = $ 2 000 | |
| Rehabilitate eroded areas | = $ 20 000 | |
3 | Backfill Eroded Area | | |
| Supply and place foundation material | | |
| 36 m x 3 m wide x 1.5 m deep @ $50/cu.m. | = $ 8 100 | |
4 | Flume Panel Replacement | | |
| 10 off x 3.6 m x 3.05 m x 0.3 m thick panels @ $1 000/cu.m. | = $ 32 760 | |
5 | Replace Concrete Tie Beams and Repair Coping Supply and install 100 tie beams @ $500 each | = $ 50 000 | $ 50 000 |
| Repair concrete coping, 600 m @ $500/m | = $ 300 000 | $100 000 |
6 | Contingency | = $ 100 000 | $ 50 000 |
| Sub Total Direct Costs (Repairs) | = $ 658 000 | $280 000 |
7 | Loss of Energy | | |
| Using Liawenee ALTAHEO for a 6 month repair period, 1.5 c/kWhr x 1/100 x 38.7 MW x 1 000 x 24 hr x 180 days | | (1 month) |
8 | Indirect Costs (Ancillary) | | |
| Safety | = $ 500 000 | $ 50 000 |
| Environmental Damage | = $ 20 000 | |
| Public Image | = $ 150 000 | |
| Political Sensitivity | = $ 900 000 | |
| Sub Total Indirect Costs | = $1 570 000 | $ 50 000 |
| GRAND TOTAL | $4 555 620 | $747 000 |
We now need to assess the risk reduction that is achievable for the various treatment options.
We can do this by looking at the residual probabilities of failure after the treatment has been completed.
Examples of this are shown below. The table following these shows the various factors for different discount rates over the period involved.
Examples of Risk Cost Exposure Reduction / Residual Calculations (Method 1)
| YEAR |
| | 2005 | 2006 | 2007 | 2008 | 2009 | 2010 | 2011 | 2012 | 2013 | 2014 |
Method One |
Condition base probability of failure | .06 | .08 | .10 | .12 | .14 | .18 | .24 | .32 | .54 | 1.00 |
Consequence of failure | 4 556 | 4 556 | 4 556 | 4 556 | 4 556 | 4 556 | 4 556 | 4 556 | 4 556 | 4 556 |
Annual risk cost exposure | 273 | 364 | 456 | 546 | 639 | 820 | 1 093 | 1 458 | 2 460 | 4 556 |
Disc factor (12%) | .8928 | .7972 | .7118 | .6355 | .5674 | .5066 | .4523 | .4039 | .3606 | .3220 |
Annual discounted risk cost NPV to 2004 | 243 | 290 | 324 | 347 | 362 | 415 | 495 | 588 | 887 | 1 458 |
Peak PV | 1 458 | | | | | | | | | |
Treatment Option — Rehabilitate as Outlined in Costs (2004) |
Probability of failure after treatment | 0.00 | .010 | .015 | .02 | .025 | .030 | .034 | .04 | .05 | .06 |
Annual risk cost exposure | 0 | 46 | 68 | 91 | 113 | 136 | 154 | 182 | 227 | 273 |
Discount factor | As shown above |
| 0 | 36 | 48 | 57 | 64 | 69 | 70 | 73 | 82 | 87 |
Peak PV after treatment | 87 | | | | | | | | | |
Risk cost reduction (NPV) | 1 458 - 87 = 1 371 |
Risk cost residual (NPV) | 87 | | | | | | | | | |
Examples of Risk Cost Exposure Reduction / Residual Calculations (Method 2)
| YEAR |
| | 2005 | 2006 | 2007 | 2008 | 2009 | 2010 | 2011 | 2012 | 2013 | 2014 |
Method Two |
Annual increased risk cost exposure | 273 | 91 | 92 | 90 | 93 | 181 | 273 | 365 | 1 002 | 2 096 |
PV disc | 243.7 | 72.5 | 65.5 | 57.2 | 52.8 | 91.6 | 123.5 | 147 | 361 | 675 |
Risk cost NPV 2004 before treatment | 1 886 | | | | | | | | | |
Treatment Option — Rehabilitate as Outlined in Costs (2004) |
Annual increased risk cost exposure after treatment | 0 | 46 | 22 | 23 | 22 | 23 | 18 | 28 | 45 | 46 |
Discounted increase | 0 | 37 | 16 | 15 | 12 | 12 | 9 | 11 | 16 | 15 |
NPV risk cost exposure after treatment | 142 | | | | | | | | | |
Risk cost reduction (NPV) | 1 886 - 142 = 1 744 |
Risk cost residual (NPV) | 142 | | | | | | | | | |
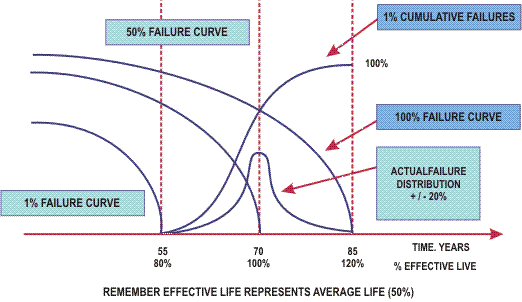
It is important to remember that about the ‘effective life’ of an asset is the 50-percentile failure curve for the asset from which we derive the average effective life of assets of this type.
We must remember that this 50% failure curve is not the same as the 1% or 100% failure curves as shown in the following figure.
We must remember that every asset has a distribution of failure and depending on the type of asset, the distribution will vary about the mean or 50% failure curve as shown.
When we plot the cumulative failure rate, we must remember that this does not reach 100% until we have reached the 100% failure curve or the far right hand side of the distribution. This obviously will be at a different time to that of the average effective life.
In the following figure you will note that the average effective life is 70 years, some assets will last as long as 85 years, whereas the earliest failures will be recorded at 55 years.
It is important to remember this when we are establishing both accumulative failures and probability of failure curves for the purposes of calculating risk exposure.
