Business Risk Exposure
This topic covers:
The business risk of assets can be broadly categorized into different levels of exposure depending on the criticality of the assets involved. The following section details the types of exposure that we can face in managing critical assets and to be able to place these failures into Business Risk Exposure Level 1, Level 2, and Level 3 on a priority basis.
Once the risk databases have been loaded and all events that pass the interim filter system have been fully assessed and reviewed for integrity and uniformity then the actual analysis tasks can be completed.
These tasks generally fall into the following activities namely:
- Cumulative risk exposure
- Distribution of probability of failure against business risk
- Distribution of consequence of failure (high consequence events)
- Identification of cause of risk (causal analysis)
- Analysis of the consequence of failure (consequential analysis)
- Identification of asset types in terms of risk exposure
- Identification of risks associated with system elements or facilities
- Sensitivity assessments:
- Changes in the probability of failure
- Changes in the consequence of failure for both total and indirect costs.
Looking at these in more detail we can look at both the objective and activities involved in each of these analysis techniques.
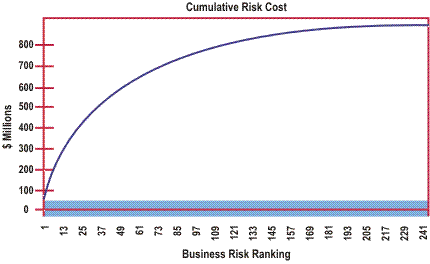
By using the database to generate the current business risk cost exposure for each of the individual events we can then rank them in ascending order of risk cost to show both the total risk cost exposure of the organization and the order of the individual risk cost exposure.
This enables us to clearly identify those assets and failure modes that represent the greatest risk to the organization while getting a clear idea of the total number of events that could occur. It is also useful information to assist us in determining the potential risk reductions available to us once we begin to compare the costs of this risk reduction, i.e. in some cases the greatest risk reduction will not be achieved with the highest risks.
This analysis is best shown by the following diagram.
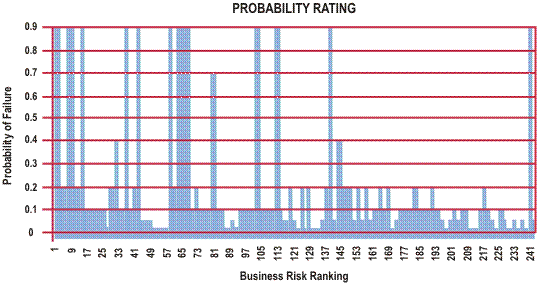
It is important for the organization to understand these risk exposures in comparison to the probabilities of these events occurring.
In many cases high business risk exposures may relate to an event that has a probability of greater than 1 in 100 years. By comparing the relative probabilities of these high-risk items the organization can weigh their risk reduction activities to those events that are most likely to happen. This will enable them to get the greatest return for their available resources. For this purpose those events that have a probability of failure greater than 40% should seriously be considered if the benefit (risk reduction) derives an adequate return.
This form of analysis can be supplemented by further sensitivity analysis as described later in this section.
This type of analysis is best shown by the following diagram.
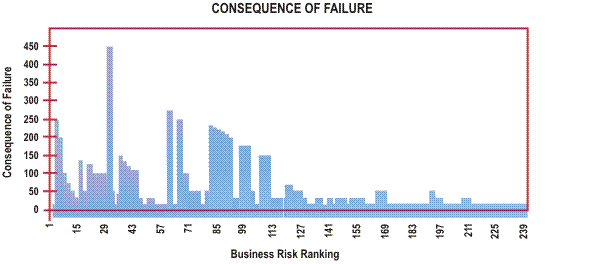
In this phase of the initial analysis process the organization needs to look at those events that would have a significant impact on their business should these failures occur.
To ensure that we take the most appropriate response to these significant risks it is desirable that the study team look at all the large consequences of failure and complete a further sanity check on the values allocated to these consequences as well as reviewing the probability of these events occurring.
It is interesting to note the significant difference between the distribution of risk cost, the probability of failure and the consequence of failure and by analyzing these three elements we can provide better understanding of the risks and the associated benefits that could be derived by the organization in their risk reduction program.
This form of analysis is best shown by the following example.
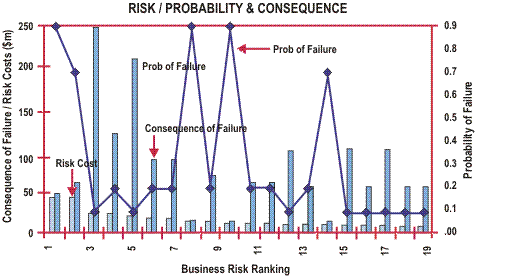
In some cases it is even more useful to show all three elements of the risk cost on the one graph using different scales and colors for the individual elements by ranking them in risk cost order.
This approach is shown in the following figure.
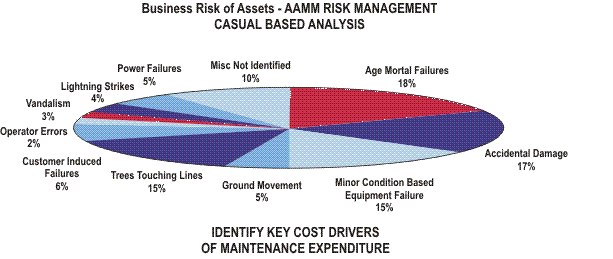
In this phase of the study the risk cost data is analyzed in terms of cause of occurrences.
This can be done either at asset or facility level or aggregated for the whole of the system being analyzed.
In this manner the business risks can be analyzed in terms of the event that is likely to cause the risk, for example:
Mortal life
Old age and poor condition could result in the physical failure of the asset.
Reliability
Poor reliability will result in poor asset performance, impact on customers and increased maintenance costs.
Operator Error
Where operator error could result in the interruption of service delivery, damage to assets or both.
External Natural Causes
For failures bought about by storm, tempest floods or lightning strikes, earthquakes, or even animals or birds.
Accidental Failure
This applies to external accident such as a vehicle crashing into the asset.
In many cases the cause of failure may require significant analysis and could be quite complex in areas such as corrosion due to aggressive ground conditions or by the intrusion of white ants or borers into structural elements.
For example secondary level causes may include:
- Inappropriate maintenance practice
- Lack of cathodic protection
- Deferred renewal work (inappropriate capital investment)
- Poor standard of original asset.
In some instances identifying these causes of failure may allow us to radically reduce the risk exposure and this could be the most cost effective treatment for these elements of risk.
An example of the assessment of the cause of failure is shown in the following diagram.
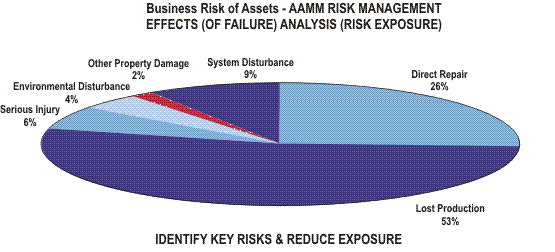
As with causal analysis described above the organization should also assess the overall consequences of failure grouping together like consequences for individual facilities or the systems as a whole.
By analyzing these individual consequences the group could quickly identify those areas where cost reduction analysis can be applied to reducing the consequences of these failures.
The consequences of failure may include:
- Customer impacts
- Direct costs of repair to the organization's assets
- Indirect third party damage to other adjacent assets
- Environmental damage
- Loss of production or loss of service and therefore loss of income
- Injury or death caused to both staff and public.
By analyzing these various consequences the organization can start to identify the various options by which these consequential risks could be reduced or averted.
For instance, if a key cost is the loss of production or the generation of income due to the outage caused by the failure then the organization could take significant steps to reduce both the time taken to restore the asset back to full production or service and the reduction in indirect damage by putting in place an appropriate emergency response or failure management plan. For example, the impact of an oil spillage can be significantly reduced by appropriate bunding and storage. The restoration of the oil storage tank can be accelerated by having appropriately trained personnel, contractors and the necessary materials readily available for the restoration works.
An example of the consequences of failure are shown in the following diagram.
Asset types at risk
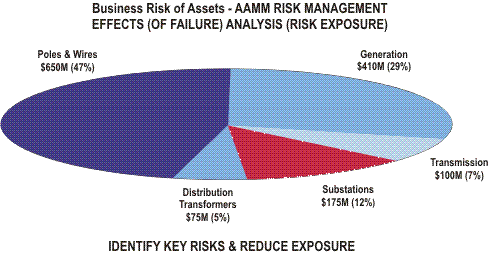
A useful analysis tool is to group like assets throughout the system or facilities and assesses their relative risk exposures.
This method of analysis enables us to identify those like assets that in their own right may not constitute a significant individual risk but when compared in their totality they may contribute a significant proportion of the total risk to the organization.
It is often the case that individual risk reduction analysis may not be justified as part of an individual ORDM analysis however the aggregated risk can justify significant analysis that can be applied to all like assets. Examples of this include:
- Air valves
- Circuit breakers
- Transformers
- Sewers
- Watermains
- Pump types
- Battery sets etc.
A sample of this type of analysis is shown by the risks associated with the following types of assets.
A further analysis technique is to assess those system elements or facilities that constitute the greatest risks to the organization.
This is similar to the previous technique except here we are looking at the way in which each of the assets interacts with each other to give a system or facility performance.
This analytical approach helps identify the most high-risk asset systems or facilities and thereby prioritize activities on risk cost reduction by relating the risk to system performance or income generation.
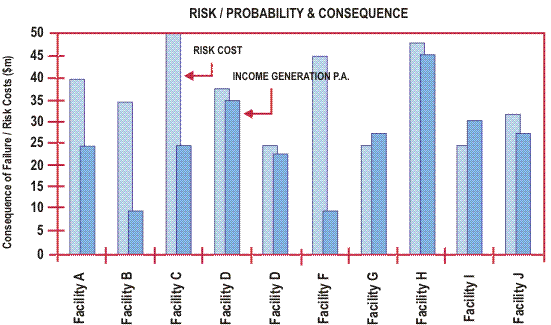
By tying the risk cost exposure to the income generation of the various systems or facilities the organization can take a business like approach to those elements that will cause it the most harm from a business sense.
This technique is often practiced by large diverse manufacturing organizations that can assess the relative risks of the various income generating elements.
To really understand the criticality of assets it is best to understand the part they play in deriving income for the business concerned.
Whether it is a utility business, a manufacturer or a major production facility, it is useful to assess the income generated by the various components that make up the total infrastructure or supply system.
This approach not only enables us to better understand the key elements that provide income to the business, but this fact can also be aligned with the current costs and future expenditure identified through the production of our asset management plans. This then enables us to look at the profit and loss statements for individual asset components, which enables us to better understand the asset which are most vital to the overall business performance.
The following diagram shows the relative current risk exposures against the income generation of electrical substations within a large transmission business.
Sensitivity assessments
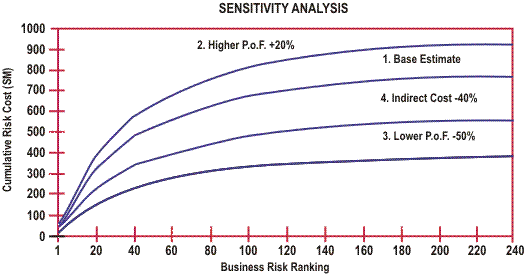
As with all economic analyses it is vital that we complete appropriate sensitivity assessments on the various factors involved in our evaluations.
The key sensitivity assessments should be completed on:
- Changes in the probability of failure by both increasing and decreasing the probability as shown in the assessments
- Changes in the consequence of failure.
Depending on the methodology used to determine the probability of failure some assessment needs to be made of the degree of confidence we have in the probabilities derived.
Depending on this assessment different sensitivity analyzes should be completed reducing or increasing the probability by factors related to the degree of accuracy of the original assessment. e.g. plus 20%, minus 50%.
In this way we can determine a distribution of risk based on this information, for example:
- Say plus 20%, 30% probability
- A figure as calculated 50% probability, negative 50%, 30% probability.
It should be noted that we are generally very conservative with our estimates of probability and on average it is quite common to find that the actual failures will be anything up to 25% or 30% lower than these educated estimates are liable to produce. It is often desirable to run this simple sensitivity as an initial pass to delay the fears of those who believe this statement to be true.
It is vital that we assess the sensitivity of our calculations on the consequence of failure.
As an initial filtering approach to this sensitivity it should be realized that we are more capable of accurately identifying the direct costs of failure than we are identifying the indirect consequences such as loss of image, environmental damage etc.
As an initial filtering approach we can therefore reduce the indirect consequence of failure by relative percentages and assess its sensitivity, e.g. -40%. This is generally sufficient for most initial business risk assessment studies however for more sophisticated studies the relative sensitivity of each of the elements that make up both indirect and direct costs should be assessed and reported on.
A simple weighting factor is capable of being applied to all consequence of failure elements and the probability of failure.
This feature makes the actual task of completing these sensitivity analyzes very easy and should be considered by all organizations undertaking risk analyzes as part of their business decision making and advanced asset management processes.
|
|
previous |
home
|
next |
|
Risk Assessment with Nomographs |
|
Risk Management Implementation
|
|